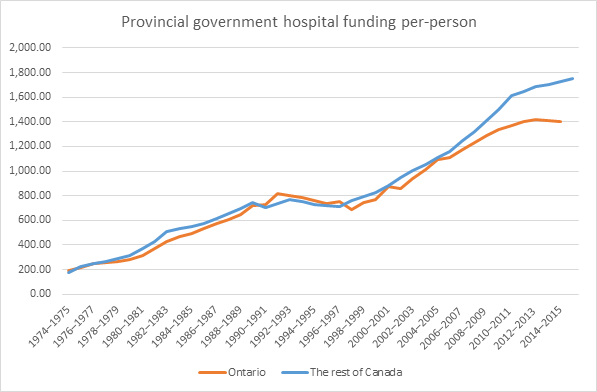
Provincial government per capita expenditures on hospitals continue to decline. This is the third year of absolute decline according to Canadian Institute for Health Information (CIHI) data.
 Of course hospital services are also affected by inflation,
like other services. One way to measure this is the total
health care price index. CIHI
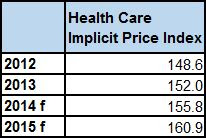
reports the health care implicit price index over this three year period
has increased by approximately 8.3% (160.9/148.6). That is equal to about
2.7% per year.
This inflation means the 2012/13 per capita hospital funding would have to increase to $1,534.95 in 2015/16
just to keep up with increasing health care prices. Instead the
government expended just $1395.73.
In other words, in three short years, the government has
reduced real spending on hospital services by 9.1% per person
($1395.73/ $1534.95). If we considered the impact of an aging population on hospital costs (usually
put at about 1% per year in extra costs), the real cut in funding would be in
excess of 12% in 3 years.
Across Canada (including Ontario) provincial/territorial
hospital funding continues to increase on a per person basis. Over the
same period, funding increased across Canada by $27.97 or 1.8%. Not enough to set off
inflation to be sure, but more than the 1.5 percent decrease in Ontario. Of course Canada-wide average is powerfully affected by Ontario. So the rest of Canada excluding Ontario saw a 3.9% increase of $65.23 in hospital funding.
$
|
Canada
Hospital
|
Ontario
Hospital
|
TROC
Hospital
|
2005–2006
|
1,138.74
|
1,111.69
|
1,159.43
|
2006–2007
|
1,217.65
|
1,177.95
|
1,247.23
|
2007–2008
|
1,283.57
|
1,230.78
|
1,321.68
|
2008–2009
|
1,360.87
|
1,291.74
|
1,410.25
|
2009–2010
|
1,430.05
|
1,333.31
|
1,496.70
|
2010–2011
|
1,515.58
|
1,368.71
|
1,613.66
|
2011–2012
|
1,549.05
|
1,405.52
|
1,645.36
|
2012–2013
|
1,577.46
|
1,417.31
|
1,684.46
|
2013–2014
|
1,587.17
|
1,409.70
|
1,704.93
|
2014–2015
|
1,599.12
|
1,402.00
|
1,729.07
|
2015–2016
|
1,605.43
|
1,395.73
|
1,749.69
|
The rest of Canada (“TROC”), excluding Ontario, spends $1,749.69 per capita. In other words, provincial and territorial governments outside of Ontario spend $353.96 more per person on hospitals than Ontario does. That is a whopping 25.3% more than Ontario. That is up 2% from the 23.3% gap in the previous year. Ten years ago, in 2005-06 the gap was only 4.3%.
In the past, Ontario closely followed Canada-wide funding patterns -- but Ontario has fallen quite a long way behind since the Liberals
were elected in 2003 – and especially since the beginning of Liberal austerity in 2010.
With hospital funding on a downward track in Ontario, that gap will continue to
grow.
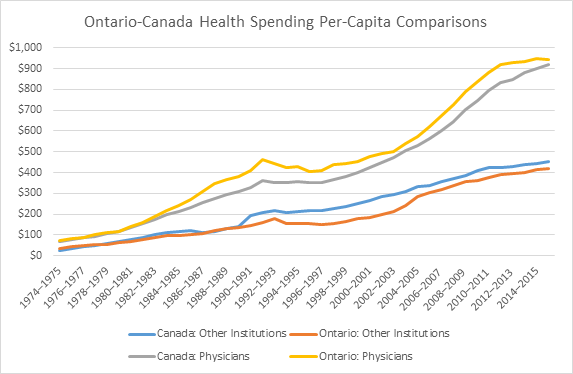
Does funding in other sectors make up for hospital under-funding? Funding for "other health care institutions" (e.g. long term
care facilities) does not make up for the lack of spending on hospitals in
Ontario. Quite the reverse. Ontario currently (2015-16) funds 7.2% less than the cross-Canada
average.
Overspending on physicians continues, currently at 2.5% more
per-capita above the Canada-wide average. This, however, is a marked
improvement from the 12.5% gap that existed in 2008-9. Indeed in the most
recent year reported (2015-16) there was a modest decline in funding per-capita by Ontario on physicians.
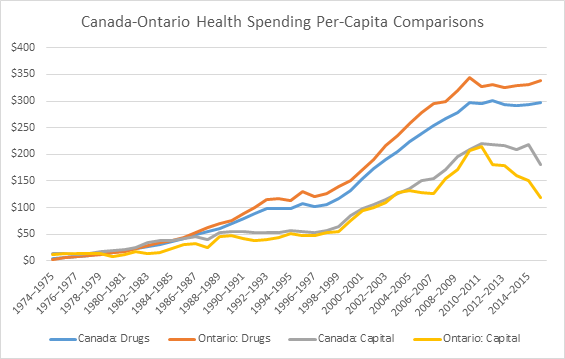
Ontario also spends more than the Canada-wide average on
drugs.
Public health funding had been higher in Ontario for the
last decade. But health care administrative funding is low in Ontario compared to Canada.
Ontario also falls
behind Canada in funding the “other health care” category (e.g. home care), funding 14.3%
less than Canada as a whole -- despite all the claims by the Ontario government about investing in home and community care. During the reign of the Liberal government, the gap in funding between Canada and Ontario has remained consistently large.
In total, after many years of closely tracking the health care spending of other provincial governments, Ontario government health care funding is now
falling quite far behind the Canadian average – with the the other provincial and territorial governments funding health care 12.7% more per person on average. And the gap is growing.
Ontario health care under-funding is primarily driven by
under-funding of hospitals, which accounts for 75% of the under-spending ($353 dollars out of $475).
Indeed, total health care under-funding has grown in tandem with the decline in
funding for hospitals in recent years.
The province of Ontario
spends more on drugs, doctors, and public health, but less on “other health
institutions,” health care administration, health care capital projects, “other health
care,” and, especially, hospitals.
For the numbers click here.
Photo: Douglas Sprott


Comments
Post a Comment