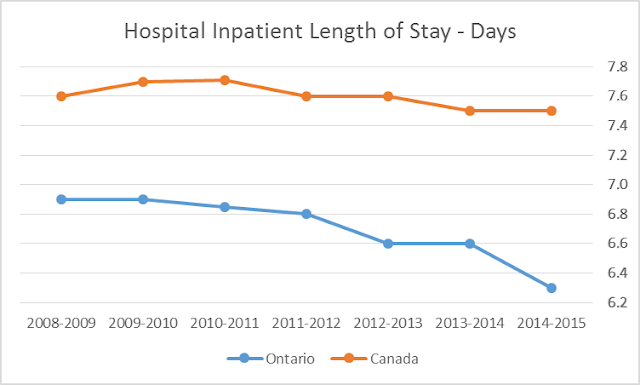
New hospital inpatient length of stay data published by the Canadian Institute for Health Information (CIHI) indicates [1] Ontario lengths of stay continue to decline, but the pace of decline has picked up, and [2] the gap between the Ontario and Canadian average length of stay is growing and has now hit startling levels.
The trend is even more apparent if we look at “age standardized average length of stays” (which standardizes the age of patients for all jurisdictions and time periods and so is probably a more accurate measure).

The government has focused on removing less sick patients from hospitals and treating them at home. So the decline in length of stay has occurred while the patients in the hospital are relatively sicker.
The more rapid decline in length of stay fits directly with the harsh funding restraint imposed on Ontario hospitals in the last few years and the increasing re-admission of patients to hospitals in Ontario. This CIHI chart shows the number of patients per 100 patients who must be readmitted within 30 days, a major increase in a few short years. This means that means about 9,000 more patients must now be re-admitted to Ontario hospitals every year.

- Since 2007/8, Ontario inpatients have 0.6 fewer days in hospital. This is a decline in length of stay of 8.7%. The Canadian average declined only 0.1 day (1.3%). The Ontario decline corresponds with the real funding cuts for Ontario hospitals in recent years.
- Much of this occurred in the last year -- Ontario inpatients had 0.3 fewer days in 2014-15, a decline of 4.6%.
- The Canadian average is now 1.2 days longer – or, put another way, Canadian patients stay 19% longer. This corresponds with the extra funding Canadian hospitals get compared to Ontario hospitals.

- Since 2007/8 length of stay has declined 1 full day in Ontario – a 14.9% decline.
- In the last single year reported (2014/15) the age standardized lengths of stay declined half a day in Ontario – or by 8.1%.
- The gap with the Canadian average has grown from 0.6 fewer days in Ontario in 2007/8 to 1.2 fewer days in Ontario.
In other words, in 2007/8 the Canadian average stay for an age standardized patient was 8.9% longer, but in 2014/15 that had grown to 21% longer. Quite incredible.

The government has focused on removing less sick patients from hospitals and treating them at home. So the decline in length of stay has occurred while the patients in the hospital are relatively sicker.
The more rapid decline in length of stay fits directly with the harsh funding restraint imposed on Ontario hospitals in the last few years and the increasing re-admission of patients to hospitals in Ontario. This CIHI chart shows the number of patients per 100 patients who must be readmitted within 30 days, a major increase in a few short years. This means that means about 9,000 more patients must now be re-admitted to Ontario hospitals every year.

In just four years between 2009/10 and 2013/14 Ontario saw a 13.6% decline in the age standardized length of stay and a 9.6% increase in re-admissions.
Where is this data from? I feel this is right but your CIHI reference doesn't suggest this at all - in fact it shows no change in 10 years. Can you correct the reference so I can use it?
ReplyDeleteThanks for the comment -- Take a look at the "age standardized" length of stay report on this page: https://apps.cihi.ca/mstrapp/asp/Main.aspx . You have to click the third bottom line on the left hand side of the page and then review LOS year by year through the charts on the right hand side. As noted, it shows a decline in age standardized LOS from 6.7 days in 2008-9 (just before the period of austerity) to 5.7 in 2014-15. Since this blog post, CIHI has reported for 2015-16 and they note an increase for that year back to 6.1 days. Hope that clarifies.
ReplyDelete